configuration manager compliance summary reports by site
Image by cell105 via Flickr
if you’ll recall from my last post, i had a bit of trouble trying to figure out a way to generate reports by authorization list. well, i got by that hurdle. the problem is the tables i was using to generate the report weren’t really designed for running on a massive scale. in fact, i started timing it and realized that it was taking on average about 3-4 seconds per machine. so for an average enterprise of 10,000 machines, it would take --
( ( 10,000 * 3 ) / 60 ) / 60 = 8.33 hours
no one really found this acceptable for obvious reasons. well, with a bit more digging, i found i could do the same kind of thing without having to aggregate the report details to generate a compliance number. instead of using v_updatecompliancestatus, i started using v_updateliststatus_live. is it just me or do they seem to be named inappropriately?
anyway, i created a new set of reports, taking a bit from the old and a bit from existing reports such as the one i created before. i think it’s more robust. certainly runs faster than before. MUCH faster! (don’t mind the blank spaces. the interesting thing about web reports is that when you use temporary tables, it displays a blank area).
UPDATE: to eliminate the blank spaces, use -
- SET NOCOUNT ON at the beginning of your statements for your temporary table
- SET NOCOUNT OFF at the end of your query after the temporary table is filled.
thanks to sudeesh rajashekharan’s answer on this post.
this is how the report set looks. it starts with a summary based on each site (blanked out):
clicking the link takes you to the site details report which looks like this:
this report lists out each machine, the last logged on user, and its state. i found it relevant to add the last known scan time and the last known heartbeat. this way scans that are old with recent heartbeats would indicate that a machine is having a problem scanning.
now clicking on an individual machine will take you to a detailed report that displays the details of each update. it would look something like this:
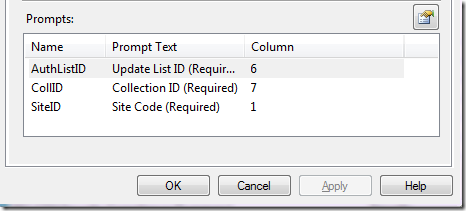
the report mof is available on system center central. (link provided at the end). once you import them, you’ll have to link them together to get the drill-downs working. here’s how you do it.
- Security Compliance (Summary)
- link to Security Compliance (Site Details)
- authlistid - column 6
- collid – column 7
- siteid – column 1
- Security Compliance (Site Details)
- link to Security Compliance (Machine Details)
- authlistid – column 6
- machinename – column 1
and there you have it. here’s the link for the report: http://www.systemcentercentral.com/Downloads/DownloadsDetails/tabid/144/IndexID/24458/Default.aspx


Worked like a charm...thanks Marcus!!
ReplyDelete