Using NETSH to Capture Packets
Outages. Aside from the massive pressure of having to restore service, they can be pretty useful to learn new things. One recent discovery that was news to me is that you can use netsh to capture network traces.
It appears on modern-ish operating systems (Windows 7/Windows 2008 R2 and above) you no longer need to install your favorite packet tracing application to capture packets. Who doesn’t like to cuddle up with a nice packet trace, eh? Obviously if you’re on a desktop OS, you should just load packet capturing utility of choice (and it had better be Network Monitor if you intend to open the .ETL trace) -- unless you like to read it in some other way. That would mean your skillz are simply amazing and are wasting your time here!
As you can see, netsh displays the trace configuration as well. It’s not the full configuration of defaults though.
Network Monitor. You can expect the same results in Network Monitor but will need to do one additional step. Even without doing it, you’ll be able to read the frame details. The frame summary won’t make much sense though.
http://blogs.msdn.com/b/canberrapfe/archive/2012/03/31/capture-a-network-trace-without-installing-anything-works-for-shutdown-and-restart-too.aspx
2 http://blogs.technet.com/b/yongrhee/archive/2013/08/16/so-you-want-to-use-wireshark-to-read-the-netsh-trace-output-etl.aspx
It appears on modern-ish operating systems (Windows 7/Windows 2008 R2 and above) you no longer need to install your favorite packet tracing application to capture packets. Who doesn’t like to cuddle up with a nice packet trace, eh? Obviously if you’re on a desktop OS, you should just load packet capturing utility of choice (and it had better be Network Monitor if you intend to open the .ETL trace) -- unless you like to read it in some other way. That would mean your skillz are simply amazing and are wasting your time here!
RUNNING A TRACE
The most basic way to start and stop a trace is by performing the following commands:As you can see, netsh displays the trace configuration as well. It’s not the full configuration of defaults though.
netsh trace start capture=yes

Trace configuration:
-------------------------------------------------------------------
Status:             Running
Trace File:         C:\Users\me\AppData\Local\Temp\NetTraces\NetTrace.etl
Append:             Off
Circular:           On
Max Size:           250 MB
Report:             Off

netsh trace stop
KNOWING THE DEFAULTS
Pulling the help file (trace start help) will provide the list of defaults if you run the command as indicated above. I have them illustrated here for reference.capture=no (specifies whether packet capture is enabled in addition to trace events)report=no (specifies whether a complementing report will be generated along with the trace file)I have highlighted the defaults which do not show up in the trace file output.
persistent=no (specifies whether the tracing session continues across reboots, and is on until netsh trace stop is issued)
maxSize=250 MB (specifies the maximum trace file size, 0=no maximum)
fileMode=circular
overwrite=yes (specifies whether an existing trace output file will be overwritten)
correlation=yes (specifies whether related events will be correlated and grouped together)
traceFile=%LOCALAPPDATA%\Temp\NetTraces\NetTrace.etl (specifies location of the output file)
VIEWING THE RESULTS
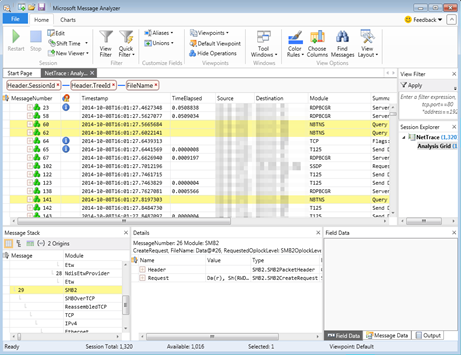
Message Analyzer. You can open the file in Message Analyzer quite simply. (It’s also a brilliant tool.) By simply, I mean, just open the file once you have it running. This is my favorite way.
Network Monitor. You can expect the same results in Network Monitor but will need to do one additional step. Even without doing it, you’ll be able to read the frame details. The frame summary won’t make much sense though.
- Go to Tools | Options | Parser Profiles.
- Choose Windows and select Set As Active.
REFERENCES
http://technet.microsoft.com/en-us/library/jj129382.aspx#bkmk_TraceUsingTracehttp://blogs.msdn.com/b/canberrapfe/archive/2012/03/31/capture-a-network-trace-without-installing-anything-works-for-shutdown-and-restart-too.aspx
2 http://blogs.technet.com/b/yongrhee/archive/2013/08/16/so-you-want-to-use-wireshark-to-read-the-netsh-trace-output-etl.aspx
Comments
Post a Comment