who is using your network? a netflow demo…
my friends at jalasoft sent me this little gem below. i’ve known about their product for a number of years. while i personally have never had the opportunity to use them, it’s impressive to see how much it has matured. if you’re using opsmgr 2012 and xian network manager, check out what you can do with netflow.
How to Know Who Is Using Your Network in Operations Manager
Jalasoft Inc.
March 2013
So you’re monitoring your network with Operations Manager 2012, but how do you know exactly who is actually using your network? How do you prevent misusage of your valuable network resources and internet access? In most cases, people are always most interested in finding out who is using the network. With Xian Network Manager 2012 this can be easily accomplished thanks to its built in NetFlow traffic analyzer. Below, we will explain how you can easily configure this feature if you have Xian NM 2012 installed.
1. Add a Netflow device
If you do not yet have a flow device available in Xian NM, you will need to add one. This is very easy. First, open the Xian Network Manager Console, next click on Device in the menu, select Flow and click.![clip_image002[4] clip_image002[4]](https://blogger.googleusercontent.com/img/b/R29vZ2xl/AVvXsEgQi71s_YvwB4R5qvnOpLzIGCOkspEzlK9iM-WKSPYE0aHrZhw_sWf3K4D64kItRMN0Rd0kw7gZ0NbJEbDuo2s63SN1KlGLGpkMzlgr8_jBu7aQzw9zxYnbtAtypwhx0-YIFGjc/?imgmax=800)
In the Rule Wizard that appears on the screen, go directly to Parameters and click on the Add Button. Now fill in the name and the IP Address of the Netflow enabled device. Verify that the device is enabled and if it is sending the Netflow packets to the machine where Xian NM is installed.
Now you can click on OK and then on Finish. A default policy template is automatically added by default, you can opt to remove this option in the Policy Template Tab. Furthermore, below we will show you how to create your own filter and set up an appropriate rule.
2. Create the Netflow filter
Next we will create a simple filter that aggregates the Netflow records to local IP Addresses. This means that it will create objects that consist on the active local IP Addresses and their corresponding traffic. In order to accomplish this you go to the Filter Tab of the Flow Device Properties. Here you click on ‘Add ‘.
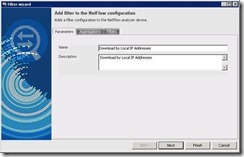
Figure 1, The parameters tab in the ‘Add filter wizard’
Under the parameters tab you provide a clear name and description. Then you click on Next.
Figure 2, The Aggregation tab in ‘Add filter wizard’
In the add filter wizard, you have to decide the criteria for aggregating our grouping up the Netflow records. For example, perhaps you would like to see the performance data grouped by Destination IP, Port, and Protocol etc. This is also important if you want to send out an alert if any counter goes over a threshold.
To be able to keep track of the incoming traffic, we suggest to group up data by destination IP. This is done in order to see the total traffic downloaded by each local IP address.
Figure 3, The Filter tab in ‘Add filter wizard’
To prevent unwanted data from being analyzed you can set up a selection under the ‘Filters’ tab, as shown in figure 3. For the Download by local IP Addresses, we are going to filter the source on only Public network IP addresses and the destination IP addresses on Private networks. Ports, protocols and ToS, will be set on all options to be able to capture all traffic.
Now click ‘Finish’ and the filter is set up. All that is missing is to enable to filter in a Rule.
3. Add the rule and define the threshold type
In order to have data arriving in Operations Manager you will need to set up a rule in Xian Network Manager. Within the rule settings you can define thresholds, intervals, severity and other settings. To start, go to the ‘Active rules’ tab in the device properties of your Netflow device. Next you add a rule. For our example we will pick the ‘bytes per second’ rule.
Figure 4, filter selection in the ‘Add rule wizard’
First you have to select the filter that you want to apply as a base for the rule in the ‘Filter’ tab. Here we will use the filter we just created to monitor the traffic going to local IP addresses.
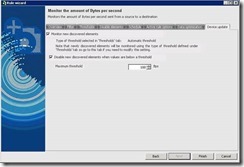
Figure 5, setting up thresholds in the ‘Add rule wizard’
Thresholds
Now you need to decide which is the proper threshold for the rule. Since there are no elements discovered yet (this will occur once the rule is running) you cannot set up specific per element thresholds.
There are three types of thresholds; Manual, Automatic and Dynamic thresholds. If you opt for manual, you will need to personally setup the upper and lower threshold. An automatic threshold only requires you telling Xian how many points it will use to calculate a manual threshold. Finally the dynamic threshold gives you the option of being alerted when traffic has sudden big changes.
Since we don’t have a clear idea of the type of traffic, we are going to select the Automatic thresholds and set it to calculate the threshold in 24 data points.
Schedule
In this part you indicate how often you want the rule to be executed and send performance data and if needed, alerts, to Operations Manager. Note that an interval that is too low (under 5 minutes) might cause performance issues on Operations Manager or SQL Server.
Figure 6, Setting up Device Update in the ‘Add rule wizard’
Device Update
Lastly, you have to point out what needs to be done when new elements appear. This is important since it is possible that during the time the rule is running new elements (IP addresses) are discovered. In this case, we set Xian NM up to discover new elements through automatic threshold, but note this will only work during the period of calculation, after this the rule will apply default settings and a manual activation of the recalculation is needed.
Figure 7, Active rules tab in the Device properties of a Netflow device.
Now you can see the rule appearing in the Active Rule tab in the Device Properties window. First, it will be on calculating mode, this will last until a threshold has been calculated. However, performance data is already sent to Operations Manager.
4. Check all in Operations Manager
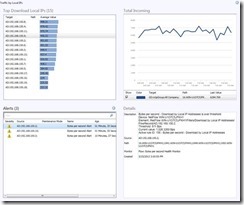
Figure 8, the Netflow dashboard in Operations Manager
If you go to Operations Manager you will be able to see all the performance data and alerts under the Xian Network Manager section. Additionally, you can create your own dashboards like the one shown above in Figure 8.
Also, you have the option to execute reports in the Reporting section and schedule them as you are used to with other Operations Manager report.
What else can you do?
This is just an example of how you can keep an eye on your environment’s network traffic, but you can probably imagine other scenarios. In a very similar way, you can analyze protocol traffic, active ports, visited websites, or even very specific ones like who is the top user of a specific SQL server.


Comments
Post a Comment